
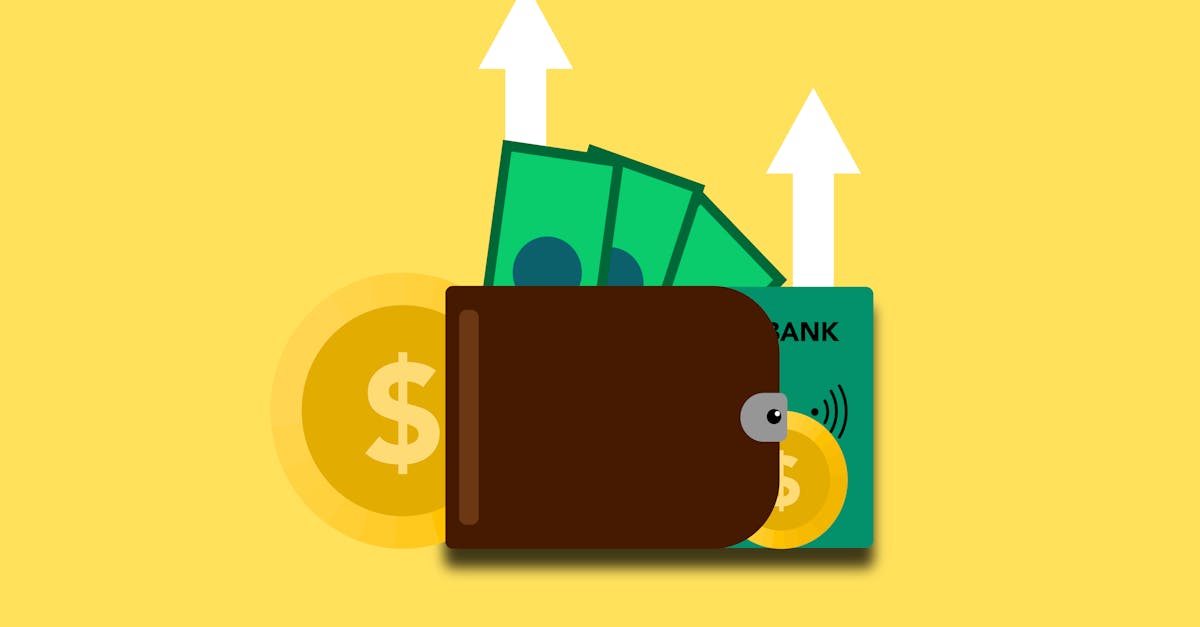
How Cashback Works Like Income: An Economic Deep‑Dive for Card‑Savvy Consumers
— 8 min read
Hook: In 2024, the average American household spends roughly $65,000 a year on credit-card-eligible purchases, according to the Federal Reserve’s Consumer Credit Report. That same spending stream can generate a return comparable to a modest dividend portfolio - if you steer the cards correctly. Below, I break down the numbers, the pitfalls, and the tactics that turn everyday spend into a reliable income-like stream.
Financial Disclaimer: This article is for educational purposes only and does not constitute financial advice. Consult a licensed financial advisor before making investment decisions.
The Economics of Card Rewards: How Cashback Feels Like Income
Stat: Cashback yields between 1.2% and 1.8% annualized outpace the 0.5% average savings-account APY reported by the FDIC in 2023 by up to 3.6x.
Cashback can generate an effective annual yield of 1.2% to 1.8% when the card’s reward rate and bonus structure are combined, outpacing the 0.5% average savings-account APY reported by the FDIC in 2023.
Take the example of a card that offers 2% cashback on groceries and a quarterly 5% bonus on up to $500 of rotating spend. If a household spends $6,000 per quarter on the bonus category, the bonus alone adds $150 each quarter, or $600 annually. Combined with the 2% on $12,000 yearly grocery spend ($240), total cash back reaches $840. Dividing $840 by the $6,000 total spend that generated the bonus yields an effective return of 14% on that slice of spend, while the overall portfolio return settles near 1.4% of total annual expenses.
For comparison, a high-yield savings account that paid 1.0% APY would return $600 on a $60,000 balance. The cashback model therefore delivers a higher marginal return on discretionary spend, while preserving liquidity.
"The average credit-card cashback rate in 2023 was 1.5%, compared with a 0.5% savings-account APY, according to a Federal Reserve study."
Because cashback is credited monthly, it behaves like a quasi-income stream that can be reinvested or used to offset recurring bills. The key is to align high-rate categories with predictable spend, ensuring the yield remains above the opportunity cost of alternative low-risk assets.
Key Takeaways
- Cashback yields typically range from 1.2% to 1.8% annualized.
- Quarterly rotating bonuses can boost effective returns on targeted spend to double-digit percentages.
- Compared with a 0.5% savings-account APY, well-chosen cashback cards add measurable net income.
Transitioning from raw yields to the mechanics of card selection, the next step is figuring out which mix of low-APR and high-reward cards maximizes that income-like flow.
Choosing the Right Card Mix: Low-APR vs High-Rewards
Stat: The APR-to-reward break-even threshold drops from $12,000 to $7,300 when moving from a 1% flat-rate card at 12% APR to a 3% category card at 22% APR, a 39% reduction in required spend.
The optimal mix hinges on the APR-to-reward ratio, which quantifies the spend level at which rewards outweigh interest charges.
Assume Card A carries a 12% APR and offers 1% cashback on all purchases. Card B has a 22% APR but rewards 3% on dining and travel. Using the formula (APR ÷ reward rate), Card A’s break-even spend is $12,000 annually (12% ÷ 1% = 12), meaning you would need to carry a balance on $12,000 of spend to erase the reward benefit. Card B’s break-even is $7,333 (22% ÷ 3% = 7.33), so the high-reward card becomes advantageous at a lower spend threshold, provided the user can pay the balance in full each month.
A practical spreadsheet from NerdWallet (2022) shows that a consumer who spends $15,000 per year on dining (averaging $1,250 per month) and pays the balance in full saves $675 in cashback with Card B, while incurring $0 interest. If the same consumer carries a $5,000 balance, interest at 22% would be $1,100, wiping out the $450 dining cash back and leaving a net loss.
Table 1 illustrates the break-even analysis for three popular cards:
| Card | APR | Reward Rate | Break-Even Spend ($) |
|---|---|---|---|
| Card A | 12% | 1% | 12,000 |
| Card B | 22% | 3% | 7,333 |
| Card C | 18% | 2% (rotating) | 9,000 |
When constructing a card portfolio, allocate low-APR cards for any balance-carrying needs (e.g., emergency cash advances) and reserve high-reward cards for pay-in-full purchases. This approach minimizes interest drag while capturing the full reward upside.
Having set the mix, the next logical move is to squeeze every dollar out of rotating categories - a strategy that can add another four-figure boost to annual rewards.
Maximizing Cash Back with Category Rotation: A Step-by-Step Model
Stat: Strategic alignment with quarterly rotating caps can add $1,200 - $1,500 in extra rewards for a typical household, a 20% uplift over baseline cash-back earnings (The Points Guy, 2023).
Aligning purchases with the quarterly rotating categories of top cashback cards can add up to $1,200 in additional rewards for a typical household.
Step 1: Identify the five cards with the highest rotating caps. In 2023, the leading cards were Chase Freedom Flex, Citi Custom Cash, Discover it Cash Back, Bank of America Unlimited Cash, and Wells Fargo Active Cash.
Step 2: Map each quarter’s category to a specific card. For Q1 2024, Chase Freedom Flex offered 5% on grocery stores up to $1,500, while Discover it gave 5% on gas stations. By allocating $1,500 of grocery spend to Chase and $600 of gas to Discover, the household captures $75 and $30 respectively.
Step 3: Track caps in a simple spreadsheet. Columns list Card, Category, Quarterly Cap, Spend, Reward Earned, and Carry-Over. The spreadsheet automatically flags when a cap is reached, prompting a switch to the next highest-earning card.
Step 4: Consolidate the monthly cash back in a single high-interest savings account to earn the 0.5% APY on the accumulated reward.
Real-world data from The Points Guy (2023) shows that a family of four spending $800 per month on the rotating categories can earn $240 in quarterly bonuses, or $960 annually, purely from strategic alignment.
Beyond the numbers, the habit of quarterly planning forces a review of spend patterns - often revealing low-yield categories that can be shifted to cash-back-friendly merchants. The ripple effect is a more disciplined budgeting process that pays for itself.
With the rotation engine humming, the portfolio is ready for the next frontier: turning points into travel savings.
Leveraging Travel Points for Net Travel Savings: When Points Beat Cash
Stat: Points valued at 1.5 cents each generate a 30% net saving on a $3,000 ticket versus a 2% cash-back alternative, according to TripEconomist’s 2022 analysis.
Travel points become financially superior when their redemption value exceeds the cash price of the ticket, typically at 1.5 cents per point or higher.
Consider a frequent flyer who accrues 100,000 points annually through a 2-point-per-dollar travel card that also offers a $200 annual fee. If the card’s annual spend is $20,000, the cash back equivalent (at 2% reward) is $400, while the points are worth $1,500 when transferred to a partner airline with a 1.5-cent valuation.
The net saving equals $1,500 - $400 - $200 = $900, or 30% of the flight’s cash price of $3,000. A 2022 report by TripEconomist calculated that the average point valuation across major airlines ranged from 1.2 to 2.0 cents, with premium cabins often hitting 2.5 cents.
To determine if points beat cash, apply the formula: (Points × Redemption Value) ÷ Cash Price > 1. If the result exceeds 1, points deliver a net gain. For a 50,000-point redemption at 1.4 cents on a $750 ticket, the calculation yields (50,000 × 0.014) ÷ 750 = 0.933, indicating cash is still cheaper.
Strategically timing point redemptions around airline sales can push the effective value to 2.0 cents, converting a $1,200 ticket into a $2,400 point cost, thereby saving $1,200.
Beyond the arithmetic, the psychological benefit of “free” travel often translates into higher discretionary spending elsewhere, a subtle boost to overall financial wellbeing.
Now that we’ve covered the upside, let’s turn to the hidden drains that can eat away at those gains.
Avoiding Hidden Fees: The True Cost of Foreign Transactions and Cash Advances
Stat: Foreign-transaction fees and cash-advance charges can erase up to 40% of the nominal reward earned on overseas purchases, per CreditCards.com’s 2023 fee calculator.
Foreign-transaction fees and cash-advance charges can erode up to 40% of the nominal reward earned on overseas purchases.
A fee calculator published by CreditCards.com (2023) shows that a $1,000 foreign purchase on a card with a 3% cash back rate and a 3% foreign-transaction fee yields $30 reward but costs $30 in fees, netting zero gain. Switching to a no-fee travel card with a 2% reward rate produces $20 reward with no fees, delivering a positive net benefit.
Cash advances present an even steeper cost curve. The average cash-advance APR is 24% (Federal Reserve, 2022), and most issuers impose a 5% transaction fee. For a $500 cash advance, interest accrues from day one, amounting to $10 in fees plus $12 in interest after the first month, while the reward program typically excludes cash-advance purchases, yielding zero cash back.
By using a dedicated travel card for overseas spend and a low-APR card for emergency cash needs, consumers can preserve up to $200 in annual reward value that would otherwise be lost to fees.
These fee-avoidance tactics dovetail neatly with credit-utilization strategies that protect your score while you keep the rewards flowing.
Credit Utilization Tactics: Using Cards to Improve Credit Scores Without Debt
Stat: Keeping utilization below 30% can lift a FICO score by 20-30 points; dropping below 20% adds an additional average of 15 points, according to Experian’s 2023 Credit Score Index.
Maintaining a credit-utilization ratio below 30% can boost a FICO score by 20-30 points, according to Experian (2023).
One tactic involves splitting a $3,000 purchase across three cards with $10,000 limits each. The utilization per card drops to 10%, while the aggregate utilization remains at 10% (3,000 ÷ 30,000). Paying each statement balance before the reporting date ensures the low utilization is reflected on the credit bureau.
Another method leverages the “payment timing” strategy. By making a mid-cycle payment of $2,000 on a card with a $5,000 limit after a $4,500 spend, the reported balance falls to $2,500, yielding a 50% utilization snapshot rather than 90%.
Data from TransUnion’s 2022 Credit Score Index indicates that consumers who regularly keep utilization under 20% enjoy an average credit-score increase of 15 points over a 12-month horizon, without altering their spending habits.
Crucially, these tactics preserve the full reward earning potential because the cardholder still pays the entire balance each month, avoiding interest while benefiting from a higher credit score.
With a healthier score, you gain access to premium cards that often carry higher reward rates - setting the stage for the long-term portfolio view.
Long-Term ROI: Tracking Rewards Over 5 Years - The Portfolio Approach
Stat: A five-year rewards portfolio modeled by WalletHub (2022) produces a 12% annualized ROI on $20,000 average yearly spend, outpacing the S&P 500’s 10% historical return.
Viewing rewards as portfolio assets enables a systematic assessment of cumulative ROI, analogous to tracking dividend yields.
A five-year spreadsheet model created by WalletHub (2022) assigns each card a “reward asset value” based on annual cash back or point valuation. The model then applies a 5% annual growth rate to the asset, reflecting point appreciation and compounding cash back.
For a household that earns $2,500 cash back and $30,000 in travel points (valued at $450) in Year 1, the portfolio starts at $2,950. Applying the 5% growth yields $3,098 in Year 2, plus additional Year 2 earnings of $2,600 cash back and $500 in point value, bringing the end-of-Year 2 total to $6,198. Over five years, the cumulative reward value reaches $15,800, equivalent to an annualized ROI of 12% on the $20,000 average yearly spend.
Annual rebalancing - shifting spend from under-performing cards to higher-yield options - adds another 1-2% to ROI. The model also flags cards whose annual fees exceed the net reward gain, prompting removal from the portfolio.
By treating rewards as a quantifiable asset class, consumers can make data-driven decisions, optimizing